
Kin Reports Second Quarter 2026 Results
PR Newswire
CHICAGO, Aug. 13, 2026
Premium in Force Climbs to $701 Million; Combined carrier adjusted net income tops $25 million
CHICAGO, Aug. 13, 2026 /PRNewswire/ — Kin, the direct-to-consumer provider of insurance and home finance solutions for homeowners, today announced operating results for the second quarter ended June 30, 2026. The results highlight continued growth across Kin’s managed reciprocal exchanges, alongside sustained operating leverage and profitability at Kin Insurance, Inc.
|
Year to Date |
Quarter |
|||||
|
($ in millions) |
Q2 2026 |
Q2 2025 |
Q2 2026 |
Q2 2025 |
||
|
Kin Reciprocal Exchanges1 |
||||||
|
Premium in Force |
$ 701.1 |
$ 572.2 |
||||
|
% Growth (YoY) |
23 % |
36 % |
||||
|
New Written Premium |
111.7 |
103.2 |
59.8 |
55.4 |
||
|
Renewal Written Premium |
285.3 |
235.3 |
159.0 |
134.8 |
||
|
Gross Written Premium |
$ 397.1 |
$ 338.5 |
$ 218.9 |
$ 190.2 |
||
|
% Growth (YoY) |
17 % |
28 % |
15 % |
25 % |
||
|
Kin Insurance, Inc. (Shareholder Interest)2 |
||||||
|
New Revenue3 |
33.7 |
28.0 |
17.9 |
14.4 |
||
|
Renewal Revenue4 |
91.0 |
77.5 |
50.2 |
44.1 |
||
|
Total Revenue |
$ 124.7 |
$ 105.5 |
$ 68.0 |
$ 58.5 |
||
|
% Growth (YoY) |
18 % |
30 % |
16 % |
26 % |
||
|
% of Gross Written Premium |
31 % |
31 % |
31 % |
31 % |
||
|
Cost of Sales5 |
6.4 |
6.5 |
3.2 |
3.3 |
||
|
Gross Profit6 |
$ 118.3 |
$ 99.1 |
$ 64.9 |
$ 55.2 |
||
|
% Gross Margin |
95 % |
94 % |
95 % |
94 % |
||
|
Growth Expenses |
64.4 |
47.8 |
33.8 |
24.7 |
||
|
G&A + R&D Expenses |
37.7 |
34.9 |
19.2 |
16.6 |
||
|
Operating Income7 |
$ 16.3 |
$ 16.3 |
$ 11.8 |
$ 14.0 |
||
|
% Operating Margin |
13 % |
15 % |
17 % |
24 % |
||
|
Growth Operating Income8 |
$ (32.4) |
$ (21.6) |
$ (16.8) |
$ (11.1) |
||
|
% Growth Operating Margin |
(96 %) |
(77 %) |
(94 %) |
(77 %) |
||
|
Baseline Operating Income9 |
$ 48.7 |
$ 37.9 |
$ 28.6 |
$ 25.0 |
||
|
% Baseline Operating Margin |
54 % |
49 % |
57 % |
57 % |
||
Premium growth at Kin’s managed reciprocal exchanges continued through the second quarter, with Premium in Force climbing 23% year-over-year to $701.1 million and Gross Written Premium reaching $218.9 million, up 15%.
Total Kin Insurance, Inc. revenue grew 16% to $68 million, and Gross Profit⁶ Margin expanded to 95%. Baseline Operating Income⁹ reached a record $28.6 million, up 14% year-over-year, even as Kin stepped up investment in customer acquisition.
“We bound more policies in June than any month in Kin’s history. All of our top-10 sales-volume days were in May and June,” said Kin Founder and CEO Sean Harper. “Even though fewer customers are shopping for insurance, Kin is capturing an increasing share of those customers. Equally important, our platform handled that new customer growth without a corresponding increase in operating costs. We built Kin to scale efficiently, and this quarter is another example of that showing up in the numbers.”
Bucking the Trend of Slowing Market Growth
Despite declining shopping activity across the industry, Kin’s momentum built steadily throughout the quarter. New Written Premium at the managed reciprocal exchanges reached $59.8 million while Renewal Written Premium increased to $159 million. May established a new company record for monthly bind volume before June surpassed it again.
The continued acceleration reflects Kin’s sophisticated consumer marketing approach that allows it to target the right customers across its 14-state footprint with its simpler, more affordable insurance solutions.
Auto Insurance Continues to Scale
Kin’s auto insurance business continued to gain traction as customers increasingly chose bundled home and auto coverage. Auto Gross Written Premium at Kin’s managed reciprocal exchanges reached $10 million during the second quarter and has already increased to more than $13 million as of August 10. Auto sales grew 83% quarter over quarter, driven by strong attachment rates among existing homeowners as well as new customers in Florida and Texas, the two states in which Kin offers bundling.
Bundling has a significant impact on retention, revenue growth, and unit economics.
“When Kin customers add auto it cuts attrition approximately in half, which combined with the additional auto revenue, generates 2-3x higher lifetime value,” said Harper. “For a product that costs Kin virtually nothing to sell, its rollout across Kin markets will continue to have a significant impact on the business.”
AI Integration Delivers Operating Leverage
From the end of Q2 2025 to the end of Q2 2026, Kin grew Premium in Force at its managed reciprocal exchanges by $129 million while G&A expenses increased only $1.7 million at Kin Insurance, Inc. — roughly $80 of growth for every incremental dollar of overhead. The majority of Kin business processes utilize AI, enabling a leaner G&A structure than its growth rate would typically demand. The company automates work across engineering, finance, underwriting, claims, marketing, operations, and customer support workflows, with humans exercising judgement, correcting AI when needed, and making sure the facts the AI and ML systems use are accurate and accessible.
“Our AI integrations allow the business to support a significantly larger book of business without increases in overhead,” said Kin Chief Technology Officer Kevin Greene. “Our existing team is handling more volume, in more states, with more products launching faster than ever, yet there has been virtually no impact on employee count. This is the promise of AI and we see it in our business every day.”
Growth Expenses at Kin Insurance, Inc. increased to $33.8 million during the quarter as the company invested to support record customer acquisition. At the same time, G&A and R&D Expenses increased more modestly to $19.2 million, allowing Baseline Operating Margin⁹ to remain at 57%, consistent with the prior-year period.
“The encouraging part of the quarter isn’t simply that we grew faster,” said Kin CFO Jerry Fadden. “It’s that our underlying economics continued to perform in line with expectations while we invested to support customer acquisition.”
Stronger Economics Benefit the Reciprocal Exchanges
The quarter’s growth also strengthened the financial performance of the reciprocal exchanges managed by Kin.
Combined adjusted net income across the two managed reciprocal exchanges exceeded $25 million during the quarter, well ahead of expectations11. New reinsurance contracts became effective in June, providing additional protection as the exchanges entered peak hurricane season.
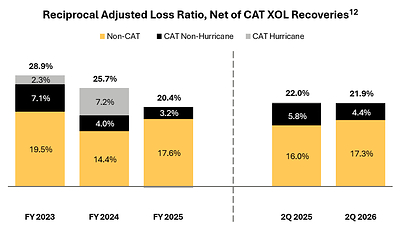
“Our adjusted loss ratio for the reciprocals held steady, aided by a lighter season for catastrophe losses industry-wide,” said Kin Chief Insurance & Compliance Officer Angel Conlin. “The reinsurance program we structured this year reflects the strength of our relationships with reinsurance partners and gives the exchanges added protection as we head into peak hurricane season. In June alone, the reciprocals generated $11 million in adjusted net income.”
Outlook
“The momentum we’re seeing isn’t tied to one product or one state,” Harper said. “We’re seeing it across home insurance, auto insurance, and home finance. At the same time, AI is allowing our teams to build and to do substantially more with fewer incremental resources than would have been possible just a few years ago. When you combine improving operating leverage and healthier reciprocal exchanges, we think we’re still in the early innings of what this platform can become.”
Kin operates in 14 states — Alabama, Arizona, California, Colorado, Florida, Georgia, Louisiana, Mississippi, Missouri, Oklahoma, South Carolina, Tennessee, Texas, and Virginia — which, together, make up 50% of the Total Addressable Market for home insurance. Known for its positive customer experience, Kin earns a 4.7 out of 5 rating on Google based on more than 9,148 customer reviews, an A+ and 4.8 out of 5 rating with the Better Business Bureau based on 1,859 customer reviews, and an “Excellent” rating of 4.9 out of 5 on Trustpilot.com based on 8,047 customer reviews (as of August 12, 2026).
About Kin
Kin provides solutions to homeowners to help them save money, simplify tasks, and protect their most valuable assets. By offering direct-to-consumer digital home and auto insurance alongside home finance services, the company focuses on supporting underserved homeowners in states with high catastrophic risk. Kin provides more convenient and affordable home and auto insurance coverage by eliminating the need for external agents and analyzing thousands of data points to provide transparent, accurate pricing. Kin complements this with home financing with Kin-exclusive rates to help homeowners secure a better mortgage rate, refinance, or tap into their equity. Kin’s AI-native technology platform delivers a seamless customer experience, customized options, and fast, high-quality service. To learn more, visit www.kin.com.
|
Footnotes |
|
|
1. |
The financial information shown represents the combined premium results of the two reciprocals managed by Kin Insurance, Inc. |
|
2. |
The financial information represents the GAAP consolidated results of Kin Insurance, Inc., excluding its variable interest entities (VIEs), which include the reciprocal insurance carriers and the captive it manages. Prior period results reflect immaterial audit adjustments from prior presentations. Quarterly results are unaudited. |
|
3. |
New Revenue is a non-GAAP measure defined as fee revenue calculated in proportion to New Written Premium as a percentage of Total Written Premium at Kin’s managed reciprocal exchanges. |
|
4. |
Renewal Revenue is a non-GAAP measure defined as fee revenue calculated in proportion to Renewal Written Premium as a percentage of Total Written Premium at Kin’s managed reciprocal exchanges. |
|
5. |
Cost of Sales is a non-GAAP measure defined as customer servicing costs and internal claims labor expenses. |
|
6. |
Gross Profit is a non-GAAP measure defined as Total Revenue less customer servicing costs and internal claims labor expenses. |
|
7. |
Operating Income is a non-GAAP measure defined as net income/loss attributable to Kin Insurance, Inc., excluding interest expense, income tax expense, depreciation, amortization, stock-based compensation, and other non-operating expenses. |
|
8. |
Growth Operating Income is a non-GAAP measure defined as New Revenue minus the portion of Cost of Sales attributable to New Revenue and Growth Expenses; Growth Expenses include sales and marketing expenses, variable data costs, and other expenses associated with customer acquisition. |
|
9. |
Baseline Operating Income is a non-GAAP measure defined as Renewal Revenue minus the portion of Cost of Sales attributable to Renewal Revenue and G&A Expenses; G&A Expenses is defined as operating expenses not associated with customer acquisition. |
|
10. |
Premium in Force is a non-GAAP measure representing the annualized in-force premium for all active policies at Kin’s managed reciprocal exchanges and certain third-party carriers as of the last day of the period. |
|
11. |
Combined Carrier Adjusted Net Income is a non-GAAP measure representing the sum of adjusted statutory net income of the two reciprocal insurance exchanges managed by Kin Insurance, Inc. These reciprocal exchanges are variable interest entities and are not consolidated within the GAAP results of Kin Insurance, Inc. described in Note 2. Figures are unaudited and based on internal management data. |
|
12. |
The adjusted loss ratio is a non-GAAP measure defined as loss and loss adjustment expenses, net of catastrophe excess of loss reinsurance recoverables divided by earned premium and the “earned” portion of subscriber surplus contributions during the period and excludes claims management fees paid to the reciprocal exchange’s attorney-in-fact. |

 View original content to download multimedia:https://www.prnewswire.com/news-releases/kin-reports-second-quarter-2026-results-302850440.html
SOURCE Kin Insurance, Inc.


